Step ① : PPT标题适当带点情绪,举几个🌰:
❌Instead of: Regional sales declined by 20% this year
⭕Use: We are losing customers at a rate never seen before!
❌Instead of: Performance analysis of competitors
⭕Use: What can we do to outperform our key competitors in FY25?
❌Instead of: A comparison of existing products
⭕Use: How Product A became the best-selling item in 2024
[向右R]讲好故事的第一个重点就是标题要足够吸引观众,而不仅仅是陈述事实
Step ②: 从听众的角度出发,想清楚这三个问题:
[向右R]Who is your audience?
[向右R]What are their goals and objectives?
[向右R]What specific questions do they need answers to?
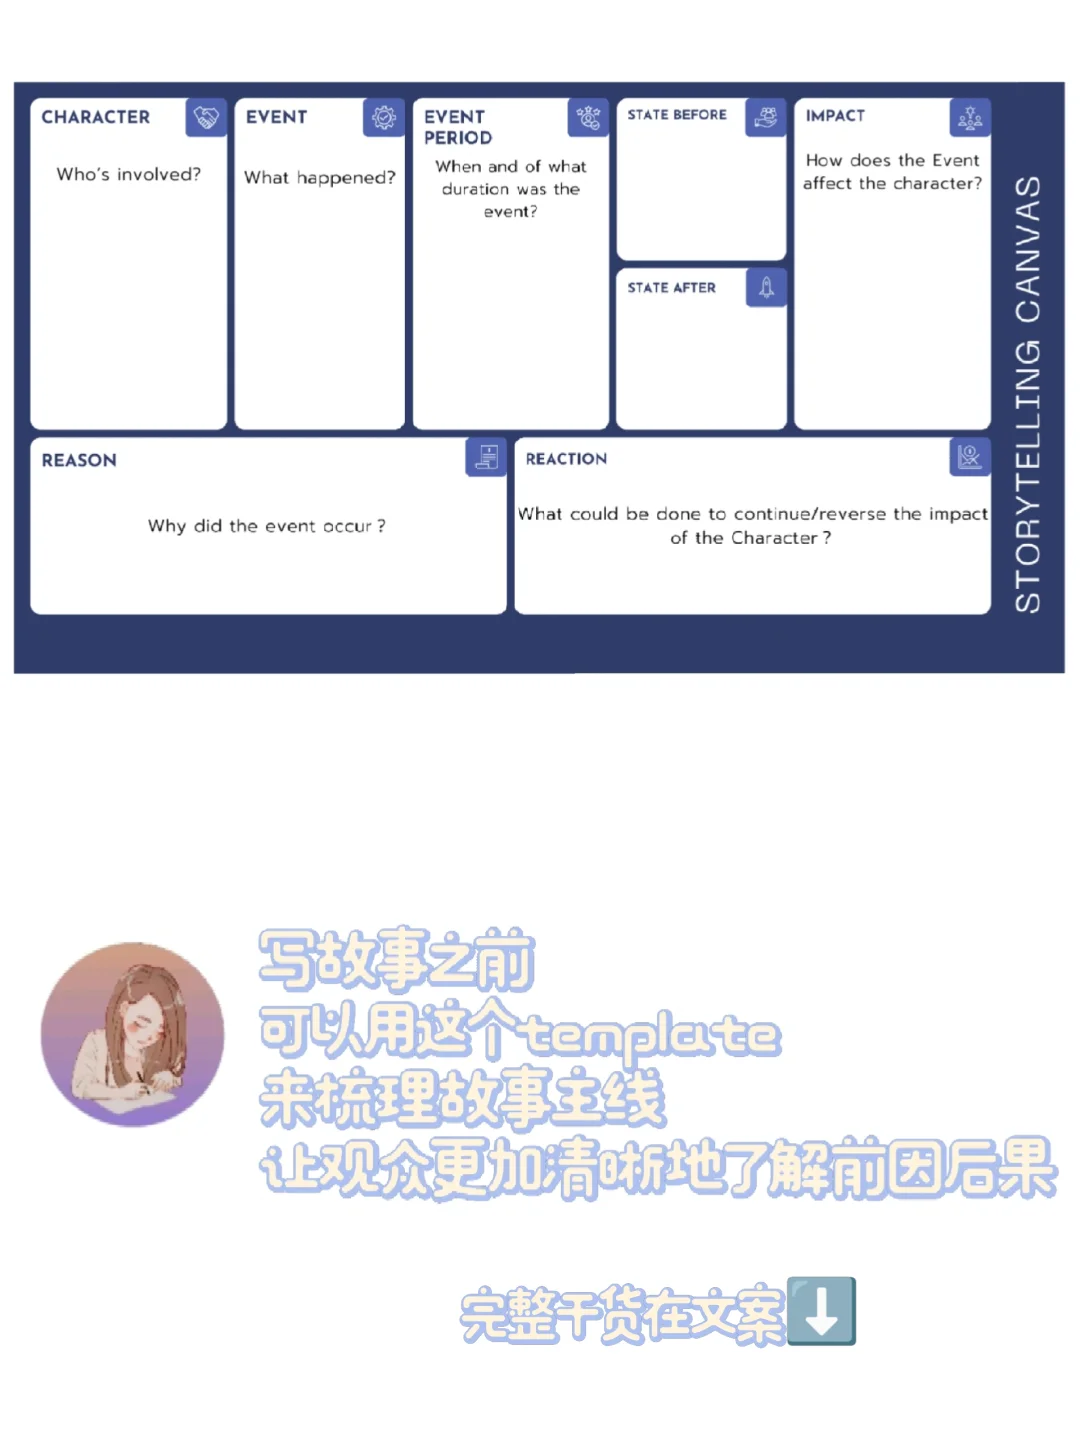
Step ③ : Gather Facts, use a Data Story Canvas,详情请见图二
[向右R]这一步的关键就是梳理前因后果,把故事有逻辑地讲清楚
Step ④: Use suitable Metrics
Metrics主要用来展现问题,变化,和结果,主要分这几种:
📊Bar Graph: To show Category or Comparison
📈Line Chart: To show trends
📱Table Diagram: To show exact values
💡Venn Diagram: To show the relationship
🔸Scatter Plot: To show the correlation
Step ⑤: 讲清楚想表达的重点 - So what?
[向右R]这里可以使用一个小技巧''ABT''来增加故事的转折点, ABT = And, But, Therefore
[栗子R]这里应用开头的第一个例子 - Sales declined by 20%
🔹AND: Over the years, we achieved steady growth and built a loyal customer base.
🔹BUT: However, sales declined by 20% in the last quarter, this is due to the economic downturn.
🔹THEREFORE: We propose to re-assess our customer's needs and adjust our portfolio to include more affordable products.
2025年打算一周更一篇英文职场实用干货,感兴趣的宝子们可以留言想要精进的技能, 共同学习,希望2025我们在海外职场一起逆袭!!